Beginning to plan for Year 2

As we reached the end of the autumn term, our first teaching the new A-level specification, my thoughts started to turn to the shape of the second year of the course. We ended the term with a training day, for which we were given no agenda from above, so I decided to spend 3 hours of this ordering the topics for year 2. For this task I worked with Will, who I have been teaching the year 12 course with. We were again joined by Simon from MEI.

One thing that we have felt has held us back slightly this year is that our framework is different to that of other schools within the trust. This is partly due to the fact that we have different structures, we only have one group and are therefore sharing the teaching between the two of us, where the other schools have more than one group and have teachers who are involved in more than one group. This makes the close collaboration that we have been able to maintain much more difficult for them. We therefore decided to try and make our second year framework possible to split into two separate teachers running in parallel, rather than just our linear system, which is effectively just one teacher. This will hopefully allow other schools within the trust to adopt our order, allowing greater collaboration in the creation of resources and assessment materials.

The scheme of work allows for 4 weeks of study at the end of year 12, after AS examinations are complete. There are nominally 6 weeks available to us but experience tells us that at least two of these will be lost to whole school events.

SoW1Our starting point was the detailed content statements from the DofE specification document. We had these cut up so that we could place them into our framework, shuffling as often as we needed. Our initial thoughts were to look for obvious connections in the content for topics that should take place close together. For example we decided that parametric equations would work well with parabolic motion. This led to us splitting the numerical methods topic into sections and placing these with other topics, for example putting the trapezium rule with integration. We then tried to place the topics into an order where any pre-requisites were taught first – surprisingly difficult with the way that the contents links together.

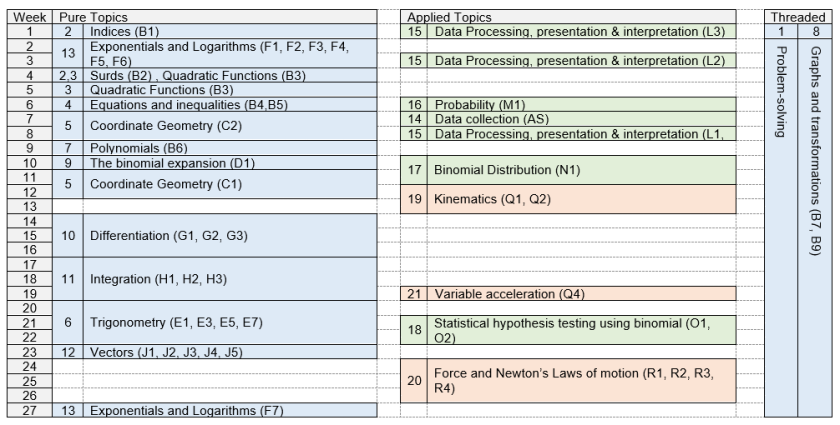
We wanted to put a large section of the trigonometry as early as possible as there are so many other topics that link back to it. The problem with having this so early is that we had not planned to have completed functions, something that links well with the inverse trigonometric functions. We decided to leave this order, but to use the inverse functions as our way in to functions, coming back to discuss the conditions that need to be placed on the domain and range. The order of topics is shown here:

SoW2

In our model of having two teachers in parallel, rather than this linear structure we moved some additional content from the left hand column to the right hand column. The topics moved were all of the trigonometry, vectors and parametric equations.

And so concluded a successful morning – we even finished in time for Christmas lunch!

The Term So Far…

It seems amazing that we are already more (now much more than when I started writing this!) than half a term into teaching the new specifications of the A-level. When we planned this half term I was concerned that we had put far too much content in and that we would never get anywhere near completing it all. Remarkably this has not been the case and we finished exactly on schedule.

The way that we have set the scheme of work up has had massive benefits, this has been particularly evident in the linking of topics that were previously kept apart by being almost arbitrarily in different modules. We have found this is useful with the relationships between indices, surds, exponentials and logarithms. This week we have seen this again in teaching binomial expansion and the binomial distribution consecutively.

I am also much more confident that I know how students are coping with the course due to the changes we have made to our assessment structures. For each unit students have completed the online Integral assessment, for which they are provided feedback. This is an automated process where we copy the data from Integral into a spreadsheet which creates a sheet for each student, detailing which questions they have got correct and which they need to redo. Corrections are made on the back of this sheet so that we have a record that they are doing this.Eg1

We have also set students the chapter assessments from Integral, which unfortunately don’t mark themselves! These are marked and entered into another spreadsheet, which again provides individualised feedback for the students. This shows students their performance in relation to the rest of the class for each question, so that they can focus their efforts on areas that they need to. It also allows us to see any areas that need revisiting with the whole group.Eg2

Where there are significant issues arising from the assessment we are able to run intervention sessions either during form periods (fortunately as Head of Department I do not have a form group) or after school.

Another interesting aspect that we have incorporated into the scheme of work is reading and comprehension tasks. At the end of half term one, as a holiday task, we asked students to read an article from New Scientist and to answer questions based on this. Our aims with our development of our practice in the new course have always been to develop students as mathematicians, not just to allow them to answer the questions in the examination. The article in question looked at prime numbers, particularly into the question of whether there was a pattern in the way they appeared. Students were challenged to answer 6 questions, starting with information taken from the article, then progressing to independent research on the topic. Unfortunately none of the students managed the sixth…

  • Define “twin prime”.
  • Using the sieve method, which is the largest prime number that needs to be used such that all of the non-primes < 100 are sieved out?
  • When does sieve theory struggle?
  • Showing your calculations, write down a list of the first 6 Germain Primes (29 is the 7th).
  • Write a paragraph of no more than 200 words about either Goldbach’s Conjecture, Germain Primes or the Riemann Hypothesis.
  • Solve the Riemann Hypothesis, donating half of your winnings to Mr Hampton and Mr Davies.

The next challenge is to find a suitable article to set for reading over Christmas!


Logarithms

In last week’s post I talked about the work that we had completed on indices and how we were using this to launch logarithms and exponentials this week. The benefits of this approach were shown up during one of the indices lessons when one of the students was tackling the following question (taken from Stuart Price’s Problem Book, @sxpmaths):

Picture 1

He asked if there was an easier way to tackle problems like this, suggesting that if the numbers were much bigger it would make the problem more difficult. This was a perfect opening for introducing logarithms, which we did with a series of similar questions.

Picture 2

When planning this lesson in discussion with Will, we felt that this approach really emphasised the link between indices and logarithms, something that we both felt had been missed by some students in previous years. We felt that the best way to do this was by talking about functions and their inverses. Yes, inverse functions is strictly a second year topic and they wouldn’t need it for their exams in the first year, but it is the connection that has been lost in the past and the reason students struggle with the topic.

In order to build these links we created a Geogebra file that allowed us to turn on an off a series of functions and their inverses. We had it set up to display a couple of linear graphs, a quadratic and then an exponential – the goal being to draw out that the inverses were a reflection in the line y=x. This had students already trying to tell us what shape the inverse of an exponential should be, before we even introduced what the function truly was. I’ve used a similar approach before, but not incorporated the graphs – so the connections were already stronger than they had been for students in the past.

Picture 3

The next part of the lesson formalised the notation of logarithms, after which we went back to these questions and rewrote them as logarithms, solving the later ones using our new calculators as we went.

The next lesson began with a recap starter, but this time we took the students a bit further…

Picture 4

They were all able to calculate the answers on their calculators, but actually explaining why was missing, and there was no real notation or workings out (yet). So when we went back through these questions we modeled taking logs of both sides of the equation, or using both sides as powers with an appropriate base. Then we could discuss that as the two functions that we’d composed were inverses that their effects cancel. All designed to reinforce the links between logarithms and exponentials as well as to lay the groundwork for exponential / logarithmic equations.

In the past we’d found that students can be quite unreliable at remembering the laws of logs, despite the connection to the rules of indices – perhaps down to the split in topics between C1 and C2. On our scheme of work this split is non-existent as we’ve run the topics together. We also decided that to further emphasise the link that we would start with the indices rules and from them actually derive the laws of logs – this might go over the heads of some of the students, but they’d have it to look back and reflect on, plus we knew that there would be a good proportion of our group that would embrace knowing why this rule exists. After doing the product law we let the students try to work out the quotient law, and even to have a go at creating the derivation on their own. This also built on our previous work on proof and on how to construct a solid mathematical argument.

picture 5

After we’d derived all the rules, the next step would be usually be to work through a series of examples, with students copying them down. As they’d already done a lot of writing I gave them the complete examples and we went through them with the students annotating why things were happening, and what rule was being used to do these things.

When we introduced ex we got the students to plot graphs in a template that we had created in Geogebra – the idea being that after they had plotted 2x and 3x and examined their gradients at each of the points we had given them that they would see that at each point,  ex has the same gradient as y-value. The group were fairly pleased with their discovery, and it allowed us to give them the reason why e is so special that it has been given its own letter. We did have one query though: “how did they calculate the value of e, so that it is the value that will them give it its own gradient?” – this came from a further mathematician, and that question became his homework.

picture 6

Much of the rest of the topic was fairly standard – log equations, hidden quadratics involving exponential equations, but with the addition of ex and ln( ) ≡ loge( ) for the new spec, however we did make one tweak to what will has been taught in the past. We felt that students could not pick up how to add logs to a term that does not have them in so that they can then combine them using the laws. Even just these 4 questions that we started together were enough to give them something to work from in the future.

picture 7

Overall we were very pleased with how the teaching of logarithms progressed over the week. In order to assess what we had covered we asked students to complete one of the Integral online assessments. Hopefully as this comes back we will see that students have a greater understanding than we have seen in previous years.

An update from the start of term

In the recent posts we have been focusing on the statistics elements of the new course. It is now time for an update on the general running of the course and the pure elements.

Firstly some background information on the new A-level group. In previous years we have offered the maths A-level in two different option blocks meaning that we have had two groups of around 10 – 12 students. With drop off as students have dropped from four to three subjects at the end of year 12 this has meant groups of 5 – 8 in year 13. This has now been considered uneconomical so we have been reduced to one option block, as it was thought impossible to combine the two groups at the end of year 12. Of course having had this decision imposed on us, we then had a greater take up of maths meaning a class of 26. The balance of this class is also unusual due to a foreign exchange programme meaning that we have a large number of foreign students joining us for the year (two Swedes, two Mexicans, one American and one Romanian). These students will leave at the end of year 12 leaving a much more manageable year 13 group.

In practical terms the sharing of the content evenly has gone extremely well, with us being able to have frequent conversations about the direction of the lessons, despite the added pressure on my time due to being head of department this year.  This has been even better than expected, as having the dialogue has meant (certainly for me and I hope for Will), that the actual planning of the lesson has been easier as I already know what I want to achieve. We have been careful to make sure that both of us have taught both pure content and statistics content to avoid being pigeon-holed as the ‘pure’ teacher and the ‘stats’ teacher.

Another positive has been the use of technology in lessons. In the first three weeks of term I have already booked and used a computer room more than I had in the previous two years. All of the students have now got their new calculators and we are settling into using them – I even treated myself to a new one, replacing the one I had used since I did my A-levels 16 years ago.

20170918_123226.jpg

Our first lesson looked at extending GCSE proof. We felt that it was really important to introduce proof as one of our key themes as early as possible. We asked students to choose from a variety of ideas, both algebraic and geometrical, to see what they could come up with. We then discussed what a proof should look like and worked on developing the skills required to build a mathematical argument. This is something that we will be returning to regularly, making sure that students are getting more accomplished.

Picture 1

Our first major topic was indices and surds. As this is largely revision of GCSE topics we decided to approach it by setting pre-learning tasks and then developing the knowledge already in place. The tasks we set were the ‘walkthroughs’ from Integral Maths. These walk students through the required knowledge of the topic, introducing ideas and allowing experimentation in an interactive way. Students are allowed as many attempts as required without it being recorded and reported to teachers.

For the indices section of the week we used the online textbook ‘Problem Book for A-level Maths’ being developed by Stuart Price (@sxpmaths on Twitter). We really like the way that this has sections for students who are at different stages of development, starting with technique for those who need more work on the basics and progressing through problem solving to puzzles & challenge. Our grade 9 students had great fun going straight onto the challenge problems, while others were absorbed by the technique section. They were also able to move backwards and forwards if required. There is also a final section for each topic which covers exam style question practice, although we did not get to this – something to use in the future.

For the surds section we used an adaptation of an activity from Integral Maths (pictured below) where students discussed how surds are simplified. We deliberately left some expressions that had not been fully simplified and asked students to present their findings to each other. Additional questions for this lesson were taken from Dr Frost Maths (@DrFrostMaths).

Picture 2

We have been really enjoying using materials from a variety of sources and with different styles. Students seem really enthused and have been seeking us out for extra support when needed. Our next topic is exponentials and logarithms. The logic behind this is that we wanted students to experience something totally new early in the course. We also felt that they fitted very well together, essentially being two different ways of looking at the same topic. I always felt that the two ends were rather artificially kept apart by the arbitrary barrier between C1 and C2, now I have the opportunity to try and teach them together.

Hopefully I will have time for an update next week!

Introducing the Large Data Set to students

This week Will has written about the first statistics lesson, with students being introduced to the LDS for the first time.

As a team, we felt that it was crucial for students to start their work on the LDS in the first week of the course. In their first week of term they had 2 lessons – their welcome to y12 & introduction to mathematical proof and then this lesson.

Being able start using the LDS early in the course, and revisit it regularly is the best way in which students will become familiar with it, and will mean that we won’t have to devote specific curriculum time to learning it as a stand-alone topic.

So onto LDS lesson 1: We jumped in at the deep end – the objective was to use the LDS to perform some calculations as well as to learn some new maths, so I picked means and standard deviations. Planned correctly this would also allow us to use paper copies of the LDS, rather than having to get into a computer lesson so early on.

Every students started the lesson with their own copy of the LDS on their desk – and asked them to look through it and tell me what is was. For such an open question I had some very reasonable comments: “it’s got all the countries in the world on”, “everything is grouped by region”, “there are statistics about the people – births, deaths, ages, and about the country and stuff” – and I was quite pleased to get that much information back, as we could’ve had a wall of silence.

We started with measures of central tendency – introducing some new notation for the mean, and summation notation. The trick here was to give them a good enough explanation to be able answer the question, but to be vague enough that they have to use the LDS to help. Eg 1 required students to find the total before dividing by 5 countries, and Eg 2 specifically required students to look at their copy of the LDS to work out the denominator (i.e. how many countries are there in Sub-Saharan Africa?).

LDS1

After I was satisfied that everyone was able to follow the examples I gave them their first task – calculating the means of all the other regions.

LDS2

Students can be expected to have to calculate the mean from summary statistics, as well as from a list of data, which is why I gave students a lot of the totals (for the regions with more countries) as well as for the smaller regions. We had a bit of disagreement with a couple of the means – most specifically the population mean. Excel was giving me the mean of 19.43, whereas when the students typed  they got a smaller answer – on inspecting the LDS we discovered that some on the countries did not have data for that field, so we should have actually been dividing by 224 instead. (That is going to be something to watch out for in the future.)

Once I’d unveiled the graph featuring all the means I asked for someone to tell me something about the birth rates. One of our more confident students was quick off the mark: “Sub-Saharan Africa has a significantly higher birth rate than any other region”. Brilliant! I was hoping for a response like that, but I wanted a reason… and I wasn’t disappointed: “Sub-Saharan Africa possibly has less access to contraception that other regions”. I then asked why both European regions might have the lowest birth rate, someone suggested that “it is cultural, that in Europe families have fewer children”. It is those types of thoughts that it I want to foster as we continue to dig through the data set.

Next we moved onto standard deviations – I would not have done that in the past, combined these 2 topics into the first lesson, but I wanted to make sure that we covered something new, especially as it will allow us to discuss average and spread of various groups of data in our next lesson. Some students found the new formulae quite complicated.  We had started with a very simple example so we could talk about calculating the sum of the squares in simple terms, but it was actually only when we started pulling figures from the LDS did the students who were to that point a bit at sea, actually start to understand how to calculate standard deviations.

LDS3

And that is pretty much where we left it – I handed out sheets that had the summary statistics on (for  and ) and allowed the students to choose what they wanted to look at. I expect that most of them will continue to examine the birth rates, but it will be interesting if anyone turns up to the next stats lesson having calculated with other statistics.

LDS4

Their homework was to spend another 45 minutes working on the data set, bearing in mind the following questions:

  • What do you notice?
  • Can you spot any trends?
  • Can you draw any conclusions / make any inferences?

At the beginning of our next stats lesson we can discuss peoples’ findings, before starting to explore how we can use Excel to handle the data.

Will’s Thoughts on the Large Data Set

Will Davies has been working with us on the scheme of work for the new A-level. Over the last few years  he has predominantly taught the statistics content for the A-level courses. Here are his thoughts on the large data set:

“When the new specifications were announced the introduction of these “large data sets” (LDS) left me sceptical, and unsure of exactly how we were going to work with them. With time came a lot more clarity; actually being able to pick over the data sets that were released with the sample assessment material meant we could start to see how they were going to be assessed, and how they might fit into our teaching.

And I have come to this conclusion: the LDS is my joint-favourite thing about the new A-Level – the other aspect being that we’ve been able to tear up the old order of topics and build a curriculum that we feel teaches maths in the most logical order and in the best manner. Being able to combine the applied topics in with the pure topics they depend on is key: e.g. binomial theorem and binomial expansion, as well as teaching variable acceleration immediately after calculus is taught.

I have read on Twitter a lot of negativity about the LDS, and I am unsure why. My instinct says that the reason is because the LDS is being perceived as a separate topic that needs to be taught in addition to other content (that we’re already unsure whether we can fit it all in satisfactorily). As a department, from very early in the process we realised that this shouldn’t be the case – the LDS is not a separate topic, it is instead the tool that you use to teach all the data-handing parts of the course.

Every time you do an example – it comes from the LDS.

Every time you set an exercise in class – it comes from the LDS.

Every time you set a homework – it comes from the LDS.

The more the students immerse themselves in the LDS the more familiar they become with it. Homeworks can be to do some calculations or create some charts (and email them to use in advance where appropriate) then as a group we can discuss next lesson. My other big idea for embedding the LDS into our lessons is to have at least once per week a Show-me / Tell-me starter (regardless of whether the lesson is going to be on stats or not). Students will be encouraged to do a little investigation themselves, then getting the class to discuss together discuss the potential causes (e.g. our outliers). This will be way in which we can as a class build up a bank of interesting observations of our LDS, just like the observation we made when we were examining the MEI sample assessment material.

MEI
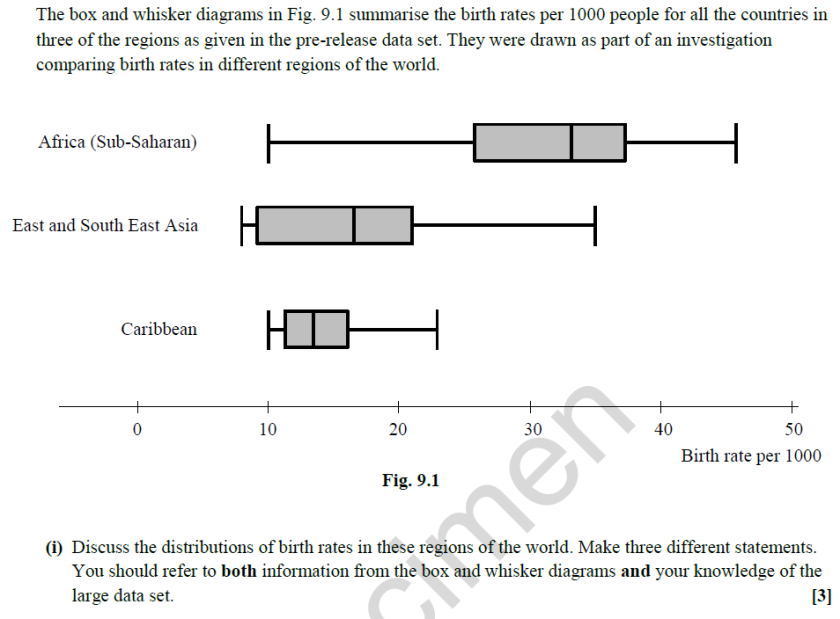
This question from the MEI sample A Level assessment – we were drawn to the very long tail at the bottom of the Sub-Saharan Africa box-plot, and wondered which countries were causing this. Looking at the LDS we quickly came up with 3 countries with very low birth rates: Saint Helena, Mauritius, Seychelles – all island nations. Which feels like a nice fact – that the island nations of Sub Saharan Africa have significantly lower birth rates than other countries in that region.

This brings me onto our choice of exam board – the data sets are not provided in the exam, yet students are expected to be able to use some very specific knowledge of them in order to gain some marks in their exams. With the large LDSs (like Edexcel’s weather data) you could study that for a couple of years and maybe still have examined at the key pieces of data.

So, MEI has the smallest large data set (covering information about the 237 countries of the world), and that brings its own advantages – it is printable. The bulk of it fits on 3 A3 pages, and I have created a single A4 page that expands on the Dependency status of relevant countries. So now all our students have a hard copy of their data set to use – meaning that we don’t always have to be in an IT room when we’re working on it. The other major advantage is that on presenting students with the data set they immediately felt that because it actually wasn’t “too big” that knowing it well was going to be achievable.20170908_153408

When it comes to using technology there are various ways in which we plan to incorporate this with the LDS. The ClassWiz calculator is clearly going to be key as, as is learning a bit about Excel. Filters, sorting and a deep look into the inbuilt statistical formulae will all need to take place – not just for the sake of the LDS, but Excel skills are incredibly useful. We’re also going to look to support/enhance teaching & learning by graphing some of the data in Geogebra and Gnumeric. (Gnumeric is apparently a very good tool for creating box-plots although I am yet to explore that any further). I have also built in Excel a sampler tool that will create random samples from the LDs, although it still needs perfecting. When it is complete I will share it here.

When it comes to assessments, starting work on the LDS from lesson 2 means we will be able to include it in assessments from half term 1 – to start with we will make sure we write the assessments so we know that students have seen (in one form or other) what we will be asking about, then we can progressively choose more and more obscure statistics to include. Finally we plan to set students extended projects to do. These like likely asked them to choose some aspect of the data set, be it a group of regions or a groups of fields, calculate some statistics, create some charts, draw some conclusions, and to write up a little report on their findings.

Identifying the smallest data set, and revisiting it weekly for 2 years will give students the best chance of becoming as familiar as they can be with the LDS (aside from dedicating too much curriculum time to it). I suppose the bottom line is that we feel that using the LDS to teach all data topics is going to be such an improvement on using (essentially random) examples that are using a similar approach with our GCSE statistics. In lessons our year 9s and 10s are currently populating their own data-set (containing information about themselves). They have really enjoyed the data collection (although I did receive a complaint from the English classroom underneath the standing long-jump) – now to analyse it!”

(Belated) Update

Things went a little bit crazy at the end of last term. The head of department made the decision to move on, culminating in me being offered the post. He then had an accident meaning that I had to take over earlier than planned. All of this has meant that my focus on the new A-level course has been broken while I have dealt with other matters.

This is a good time for me to share the decisions that we have made moving forward with the new A-level specifications.

We have decided to follow the OCR specification B (MEI). We like the way that the questions are not separated into different sections, this is closest to the way we are aiming to teach trying to emphasise the links between topic areas. As previously documented we also felt that the large data set was by far the most manageable, even allowing that it will be changing from year to year.

We have decided that we will not follow one textbook. Having received an inspection copy of most of the different textbooks there were none that really grabbed me. As such we will utilise questions and exercises from different sources, including the different textbooks and the online materials from Integral, Underground Maths, nRich and similar.

In terms of teaching we are going to follow the model that we had planned of two teachers sharing the load equally and teaching as if we were one person.

It will be interesting to see how the numbers of students sitting maths in the first year pans out. At the moment applications for the course are slightly down on the previous year, but that is to be expected as they were a smaller year group. Numbers for further maths are considerably down, but again that was expected given the small numbers of suitable students. Hopefully a clearer picture will emerge from GCSE results day tomorrow, grade boundaries are going to have an impact.

Scheme of work and developing a teaching plan

This post is contributed by Simon Clay who is part of the Teacher Support team at MEI.

Given that the changes to A level mathematics are significant, an overhaul of teaching schemes for the new two-year long qualification is not a trivial task.  During 2016-17 a number of members of staff at MEI developed a Scheme of Work for the new A levels with the aim of trying to produce something useful for as wide a range of audience as possible.  This result is this freely available SoW, accessible via the MEI website.

Some of the thinking behind the design of the SoW units was as follows:

– It aimed to break down the new A level content into manageable units.

– It needed to function as a starting point for discussions in departments and therefore needed to be editable.

– It needed to take seriously the changes in emphasis of the new A levels, including the three overarching themes – Mathematical argument, language and proof; Mathematical problem solving; Mathematical modelling.

– It needed to incorporate useful features such as ideas as to how the use of technology can permeate the teaching of A level mathematics, questions which promote mathematical thinking, etc.

– It needed to be both adaptable and useable in the classroom.

– It needed to exemplify, and give free access to, some high quality teaching resources which can be ‘picked up and used’ in any classroom.

Since its launch in March, we have been pleased with the way the SoW has been received.  A common request, however, was for the provision of a plan for how the units could be linked together in a cohesive way to ensure the content is covered in the time available.  We have therefore worked on producing a series of schedules which show how the units of the first year (or AS content) can be arranged depending on considerations or constraints a department may have e.g. two teachers sharing a group, one of whom teaches pure and mechanics while the other teaches pure and statistics.  (We have so far only tackled Year 1 content but Year 2 will follow in due course!)

The reason for a post in this blog is because Schedule E is as a result of the thinking and work done by Bruce and the team at TGA Redditch.  It has been my privilege to take part in the discussions in which this SoW Schedule has been developed.

Below is an image of Schedule E taken from mei.org.uk/2017-sow and beneath this I describe the key features:

Image of 'Schedule E'

– The team wanted to begin the course with an emphasis on problem-solving and proof in order to set the culture of working in this way from lesson 1.  This means lesson 1 will contain no mathematics beyond GCSE and will instead focus on reasoning, language and proof.  Lesson 2 will look at indices but with an emphasis on reasoning and proof rather than subject content coverage.

– There was a strong desire to get the students working with and becoming familiar with the large data set (LDS) right from the start of the course.  Thus by the end of the first teaching week students will know about the LDS and have done some initial exploratory work using it.

– The team identified some units, namely ‘Problem-solving’ and ‘Graphs and transformations’ as being recurring themes which can be addressed in a number of different units throughout the course rather than taught as discrete topics.

– The team wanted to use a teaching model where the class is shared between two members of staff but essentially runs as a single series of lessons.  This will clearly involve a high level of collaboration between them but they are keen to dovetail their teaching so that the student experience is as coherent and seamless as possible.

– They wanted the applied units to be taught alongside the relevant pure unit so it is clear what mathematics is being applied.  It is hoped that this will also help with fitting in the content in the time available.

– They wanted technology to be used by teachers and students whenever possible and so in the first few weeks there are planned opportunities for this, in particular when analysing the LDS and exploring graphs of exponential functions .

– The school has made a central decision that all students need to be prepared and entered for AS level examinations at the end of Year 12. This means that although at points it would be nice to extend and cover Year 2 topics straightaway these will need to wait.

And now there are only a few weeks until the schedule can be implemented!

Problem Solving and Technology

In our work on revamping the curriculum for the new specification we have been careful to make sure that we are considering the overarching themes of problem solving and use of technology. We are very keen to ensure that use of technology does not become ever more complicated and ‘interactive’ PowerPoint files that are demonstrated from the front of the class room with little chance for students to use and develop their own skills. We also want to introduce this aspect as early as possible to encourage students to think about technology as a vehicle for working on and solving problems when they get stuck. On Friday I met with Simon, Fiona Kitchen (from FMSP) and two colleagues from my department to discuss methods for this.

Our starting point was to use the worksheet “Problem Solving with Geogebra” from MEI’s scheme of work. We looked at solving the problems ourselves, trying to limit techniques to those that year 12 students were able to use. This proved rather difficult! After much wrestling (and a plea to twitter) we managed to create working models in Geogebra for the first three of the problems.

We had a lot of fun working on these problems but concluded that the level was a too high for students who are starting out in year 12. As such we will need to adapt to something closer to GCSE if we are going to introduce Geogebra in this way at the beginning of the course. One thing that struck me during the afternoon was that we persevered with the problems for a long period, around 2.5 hours. This was something that our students would have really struggled to achieve. The same morning one of my year 11 students, when confronted with a difficult question, said “It’s alright for you sir, you are good at maths and can do it easily.” I was unable to make her understand that I don’t find all maths easy and that I enjoy the struggle with harder problems. This perhaps sums up the major problem we have been fighting against with our A-level students over the last few years – the lack of resilience as soon as a problem gets complicated.

Hopefully this process of really concentrating on both problem solving and technology will help to improve this, which is certainly the focus of what we are looking at during this process. For now though here are the problems that we worked on.

Problem 1Problem 1

With this problem I found it very easy to create a polynomial fixed by the points A, B and C. This initially created a point D that moved as A, B and C moved. To do this I used the measuring tool in Geogebra to calculate how far away the points were from the origin.

My second attempt used a division at the start of the polynomial to allow me to control point D as well. It was at this point that I realised the shortcomings of my method of measuring distances – when I moved the points to negative values Geogebra continued to measure them as positive. To complete the problem Simon showed me how to use just the x-ordinate of A etc. in the calculation. My final solution is at: https://www.geogebra.org/m/bZD6fARj

Problem 2Problem 2

For this problem I started by drawing a circle centred on the origin with a point on the circumference fixed into the side AC. I then created another circle centred on C which connected to the first. I repeated this methodology to create a third circle centred on point B. The three circles could then be manipulated together until I had a solution that worked. This did not satisfy me – I wanted to be able to change the triangle and the circles to remain a solution to the puzzle.

My instincts for this puzzle were probably from spending time playing the mobile phone game Euclidea – maybe those hours were not completely wasted! I guessed that the points where the circles met on the edges of the triangle were those where the circle inscribed in the triangle also touched the sides of the triangle. My resulting solution can be found here: https://www.geogebra.org/m/jMSThZg8

Problem 3Problem 3

Problem 3 caused me the most problems. For a long time I was able to either create a line that was perpendicular to the tangent from A or a line that passed through the point B but not both. After a long time trying (and a plea to Twitter), Simon came up with a solution that can be found at: https://www.geogebra.org/m/MFgcJaAd

Problem 4

We ran out of time before tackling problem 4 and I have not yet returned to it. I have some ideas about using a quadratic function with roots that are the x-ordinates of A and B and integrating it but have not progressed any further yet. I leave that one with you…

Thoughts on Large Data Sets

One of the thoughts that came out of my most recent meeting with Simon was that the choice of exam board will be influenced by the large data set. I had previously been of the opinion that I could leave the choice until January 2018, seeing if any more specimen/mock papers became available and analysing question types. However this would mean not spending as long familiarising students with the specific large data set for whichever exam board we choose. As a result of this I have downloaded the data sets for AQA, Edexcel and both specifications of OCR. I should point out that I am not a statistician, I have taught S1 once and try to avoid it if I can!

I have started to look at the data sets to see which is most useable, and which students will be able to best gain insight into for reproduction in their exams. We want to be revisiting the data constantly, so that students are really familiar with it. This means that portability is important as we will not always be able to access computer facilities.

AQA – Purchased quantities of household food & drink by Government Office Region and Country

The data given is split into 10 regions (under separate tabs), with the average amounts of various foods and drinks per person per week. There is also a tab with averages for the whole of England. Having spent some time in Excel playing around with the data it is possible to fit each region onto a single sheet of A3 paper (total of 11 sheets).

AQA 1Looking at the questions in the specimen paper, students are expected to be able to recall information about the average amounts of certain food groups from different regions. This is something that could only be known by someone who has done extensive work with the data set before, and given the sheer scale of the data is unlikely to be something that you could repeat for all of the different food groups.

AQA2
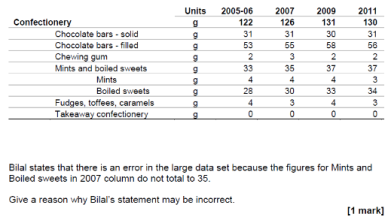
Later questions involving the data set give a small excerpt and ask questions about these. These are much more accessible to students who do not have as much familiarity, but will be easier for those who are aware of the context. For example there is question about the total amount of confectionery purchased, which does not state that it is based on averages.

Total Marks based on Large Data Set in AS Spec Paper: 9 (Out of 80 on paper 2, 160 across the AS)

OCR A – Method of Travel / Age Structure

The OCR A specification looks at the methods of travel to work, broken down into regions, taken from the national census in 2001 and 2011 (separated into two sheets). There is also data about the ages of the residents of the regions (2 further separate sheets). Each tab can be set to cover three A3 pages, so a total of 12 will be needed for a portable copy.

OCRIn the question pictured here it would be advantageous to be familiar with the data set, particularly for part (ii), as there are different codes for the authorities based on their type. If you knew this then you would know how to separate the authorities further and would merely have to explain this.

For the other question based on the data set (not pictured), a summary table has been created. It is not as obvious what the benefits to knowing that data are here, although general familiarity and having looked at possible summary statistics will help.

Total Marks based on Large Data Set in AS Spec Paper: 8 (Out of 75 on paper 1 and 150 across the AS)

OCR B (MEI) – Population data and Olympic success

The first thing to note here is that the MEI specification (OCR B) has taken a very different position to the other boards. There will be three different data sets that will be used in rotation. The data sets that will be used for ‘live’ specifications are not available yet.

MEI
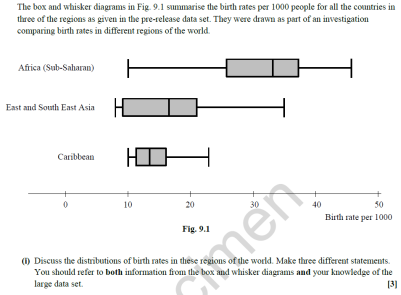
The data set that is available for the specimen papers is far less ‘large’ than the others, reducing to two A3 sheets. The question included here really grabbed me as being interesting – what were the outliers in Sub-Saharan Africa? On inspection, the data that stood out was that from islands, rather than countries on the continent.

This data set seems much more manageable than the others, and over two years I would expect students to be able to become very familiar with it.

Total Marks based on Large Data Set in AS Spec Paper: 7 (Out of 70 on paper 2 and 140 across the AS)

Edexcel – Weather Data

Edexcel’s weather data consists of 5 weather stations in the UK and 3 from abroad, with readings from both 1987 and 2015. I have been able to fit the data for each station, for a single year, on one A3 sheet (total 16 sheets).

EdexcThe questions based on this data set again seemed to not require much detailed knowledge of the readings. In the question shown here it is only the fact that there is one reading per day that will help with part (b).

Of course, as Edexcel has not been accredited yet, this may change.

Total Marks based on Large Data Set in AS Spec Paper: 11 (Out of 60 on paper 2 and 160 across the AS)

Summary

While the use of the data set will only form part of my decision on which exam board to use, I have found the process of sifting through the data sets, and the questions that relate to them, extremely useful. It has also shown me the benefits of this approach. In starting to look at the data sets it is already noticeable how the data is starting to feel familiar. I think that this will develop much more ownership of the data and make structuring easier. Now students know they are expected to know the data set, they are more likely to see the value in using it as part of exercises.